One of the standout features of ReinforceUI Studio is its comprehensive logging system. Our platform automatically logs training data, evaluation results, curve plots, and model checkpoints. This functionality simplifies the process of analyzing, comparing, and refining your experiments.
You can monitor the log folder throughout the entire training process as many times as needed by clicking the “View Log Folder” button on the main screen.
Whether you complete the training process or stop it for any reason, all essential files will be saved automatically. By default, the log folder is stored in your home directory for convenient access.
The log folder name corresponds to the date and time the training session starts, ensuring easy identification.
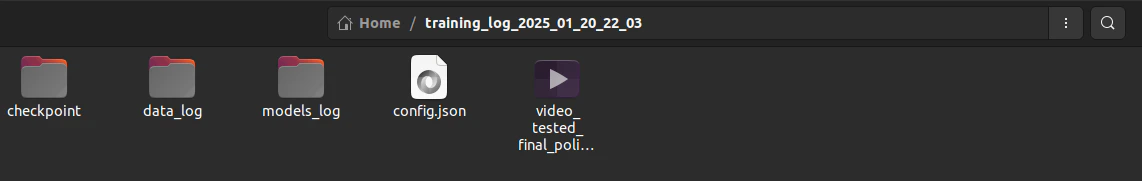
Contents of the Log Folder
This folder stores the checkpoints created during training. These checkpoints act as backups in case the training is interrupted unexpectedly (e.g., due to a power outage).
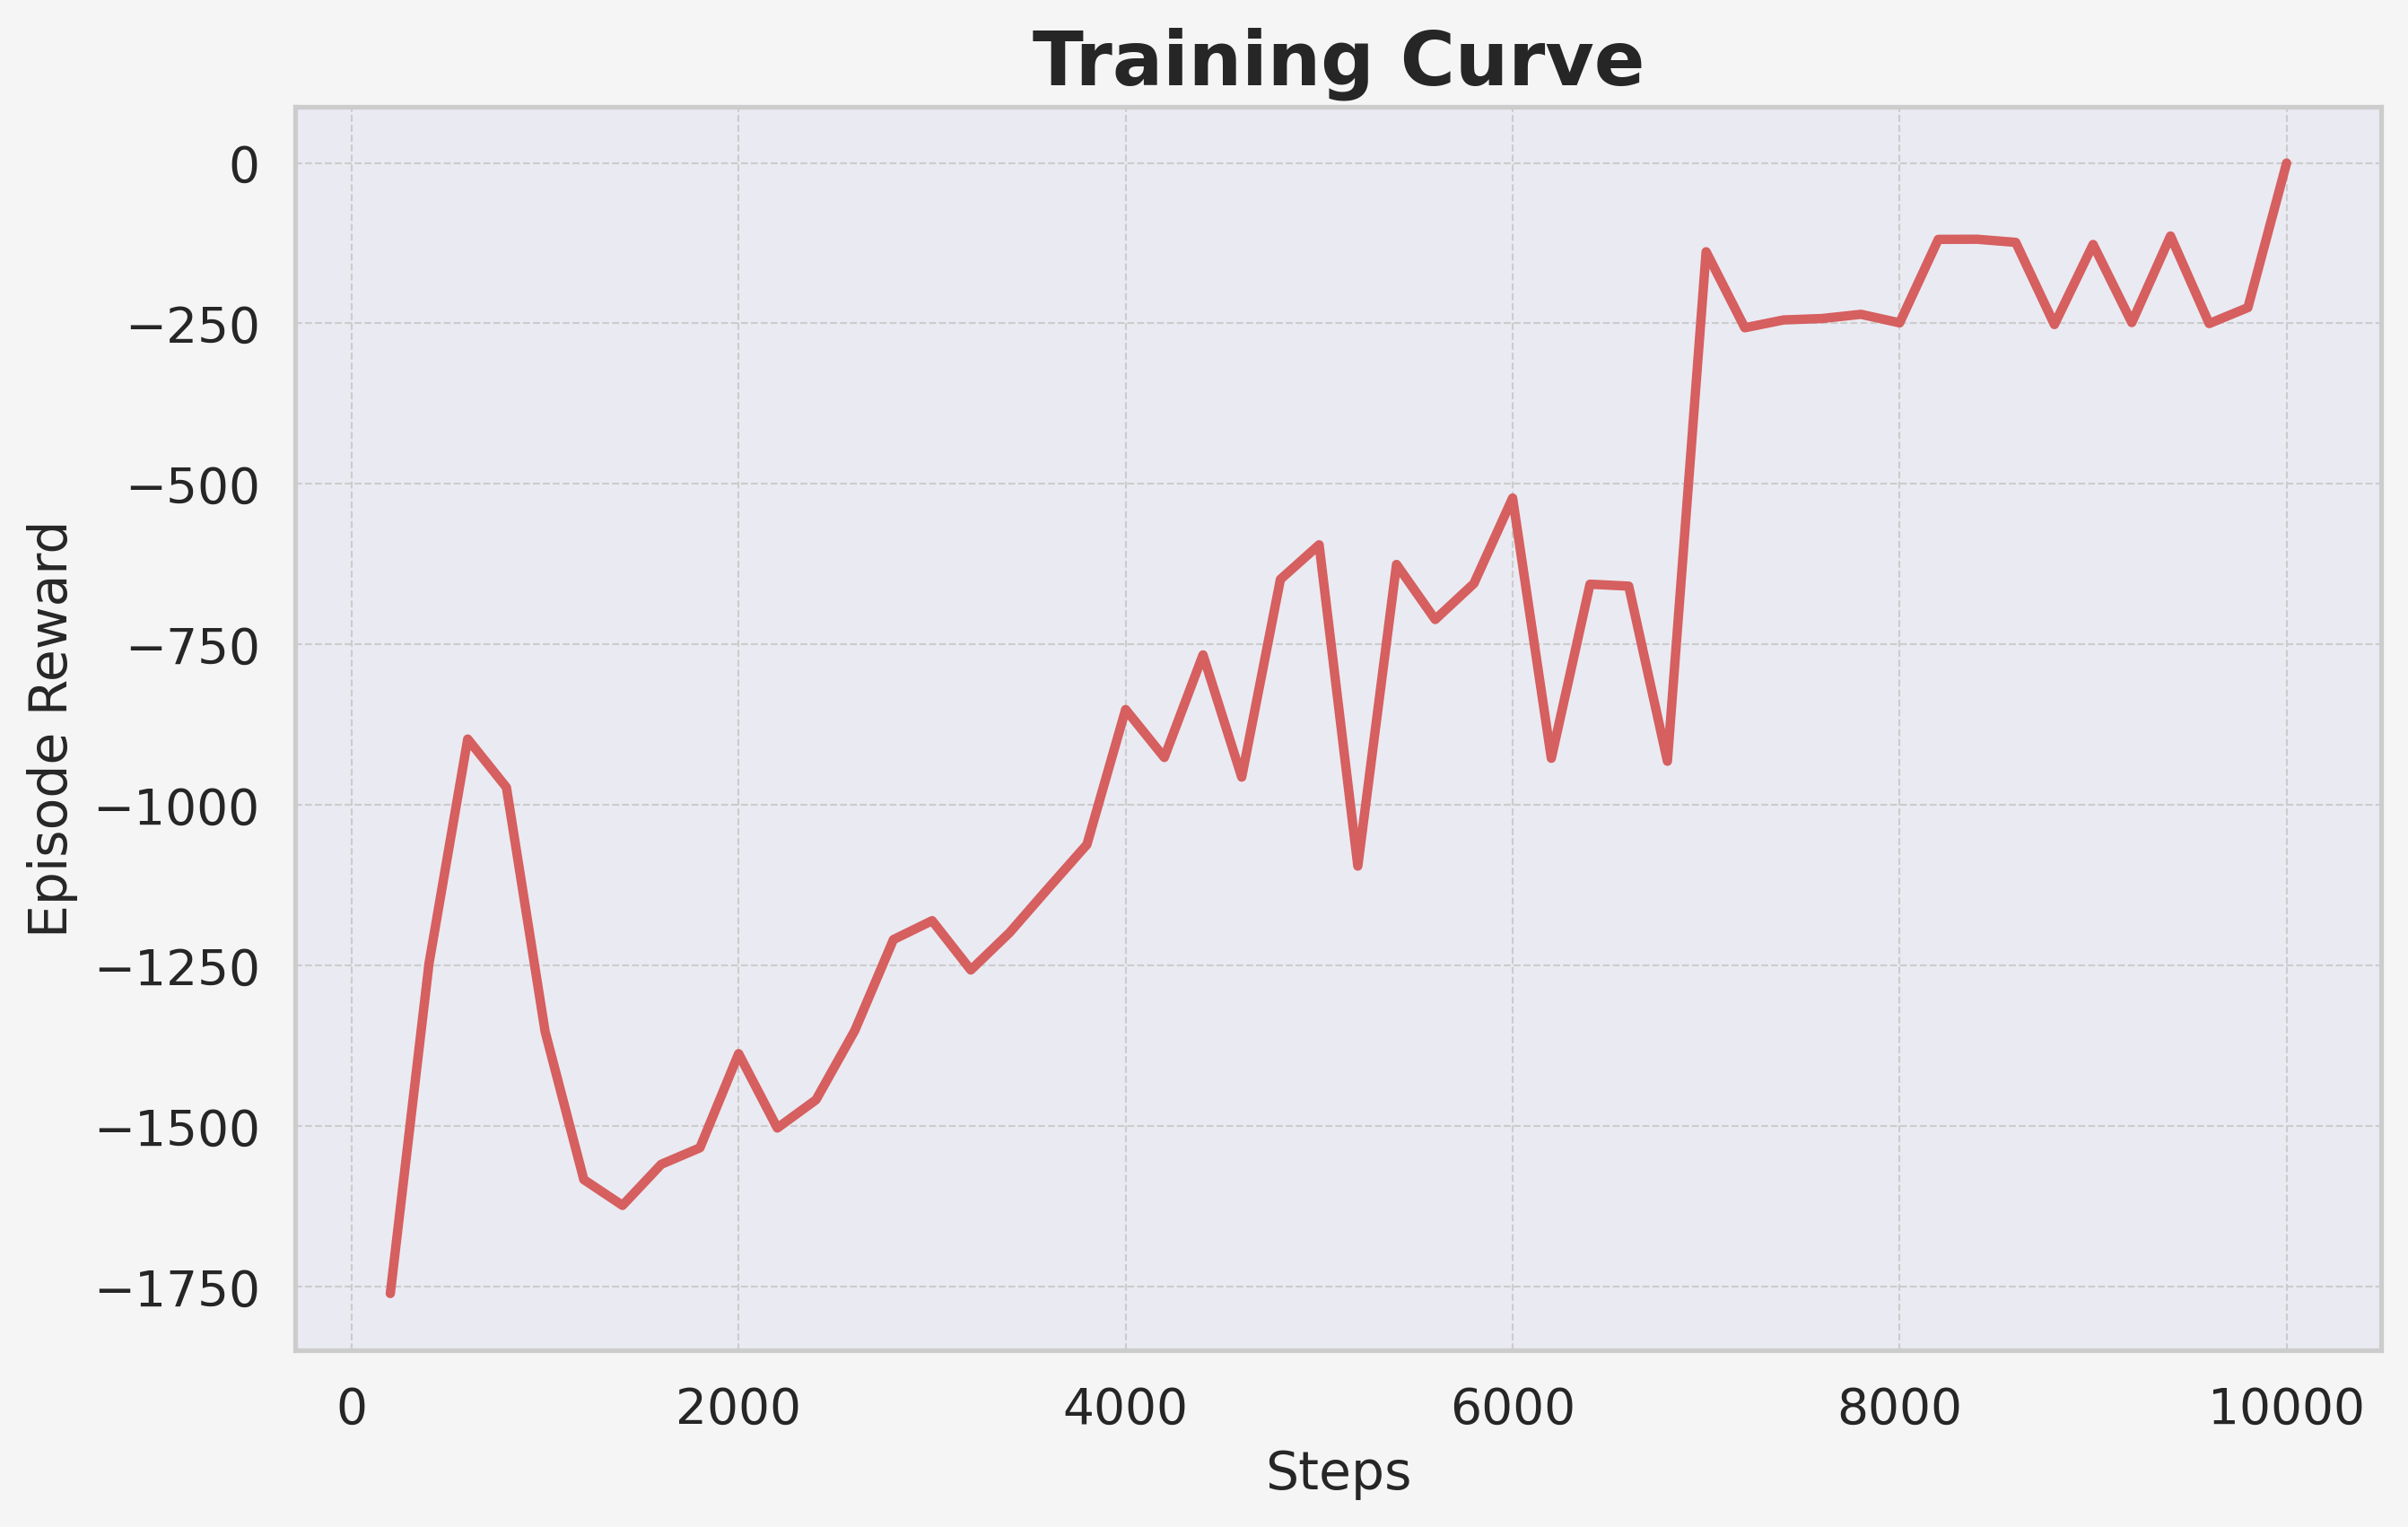
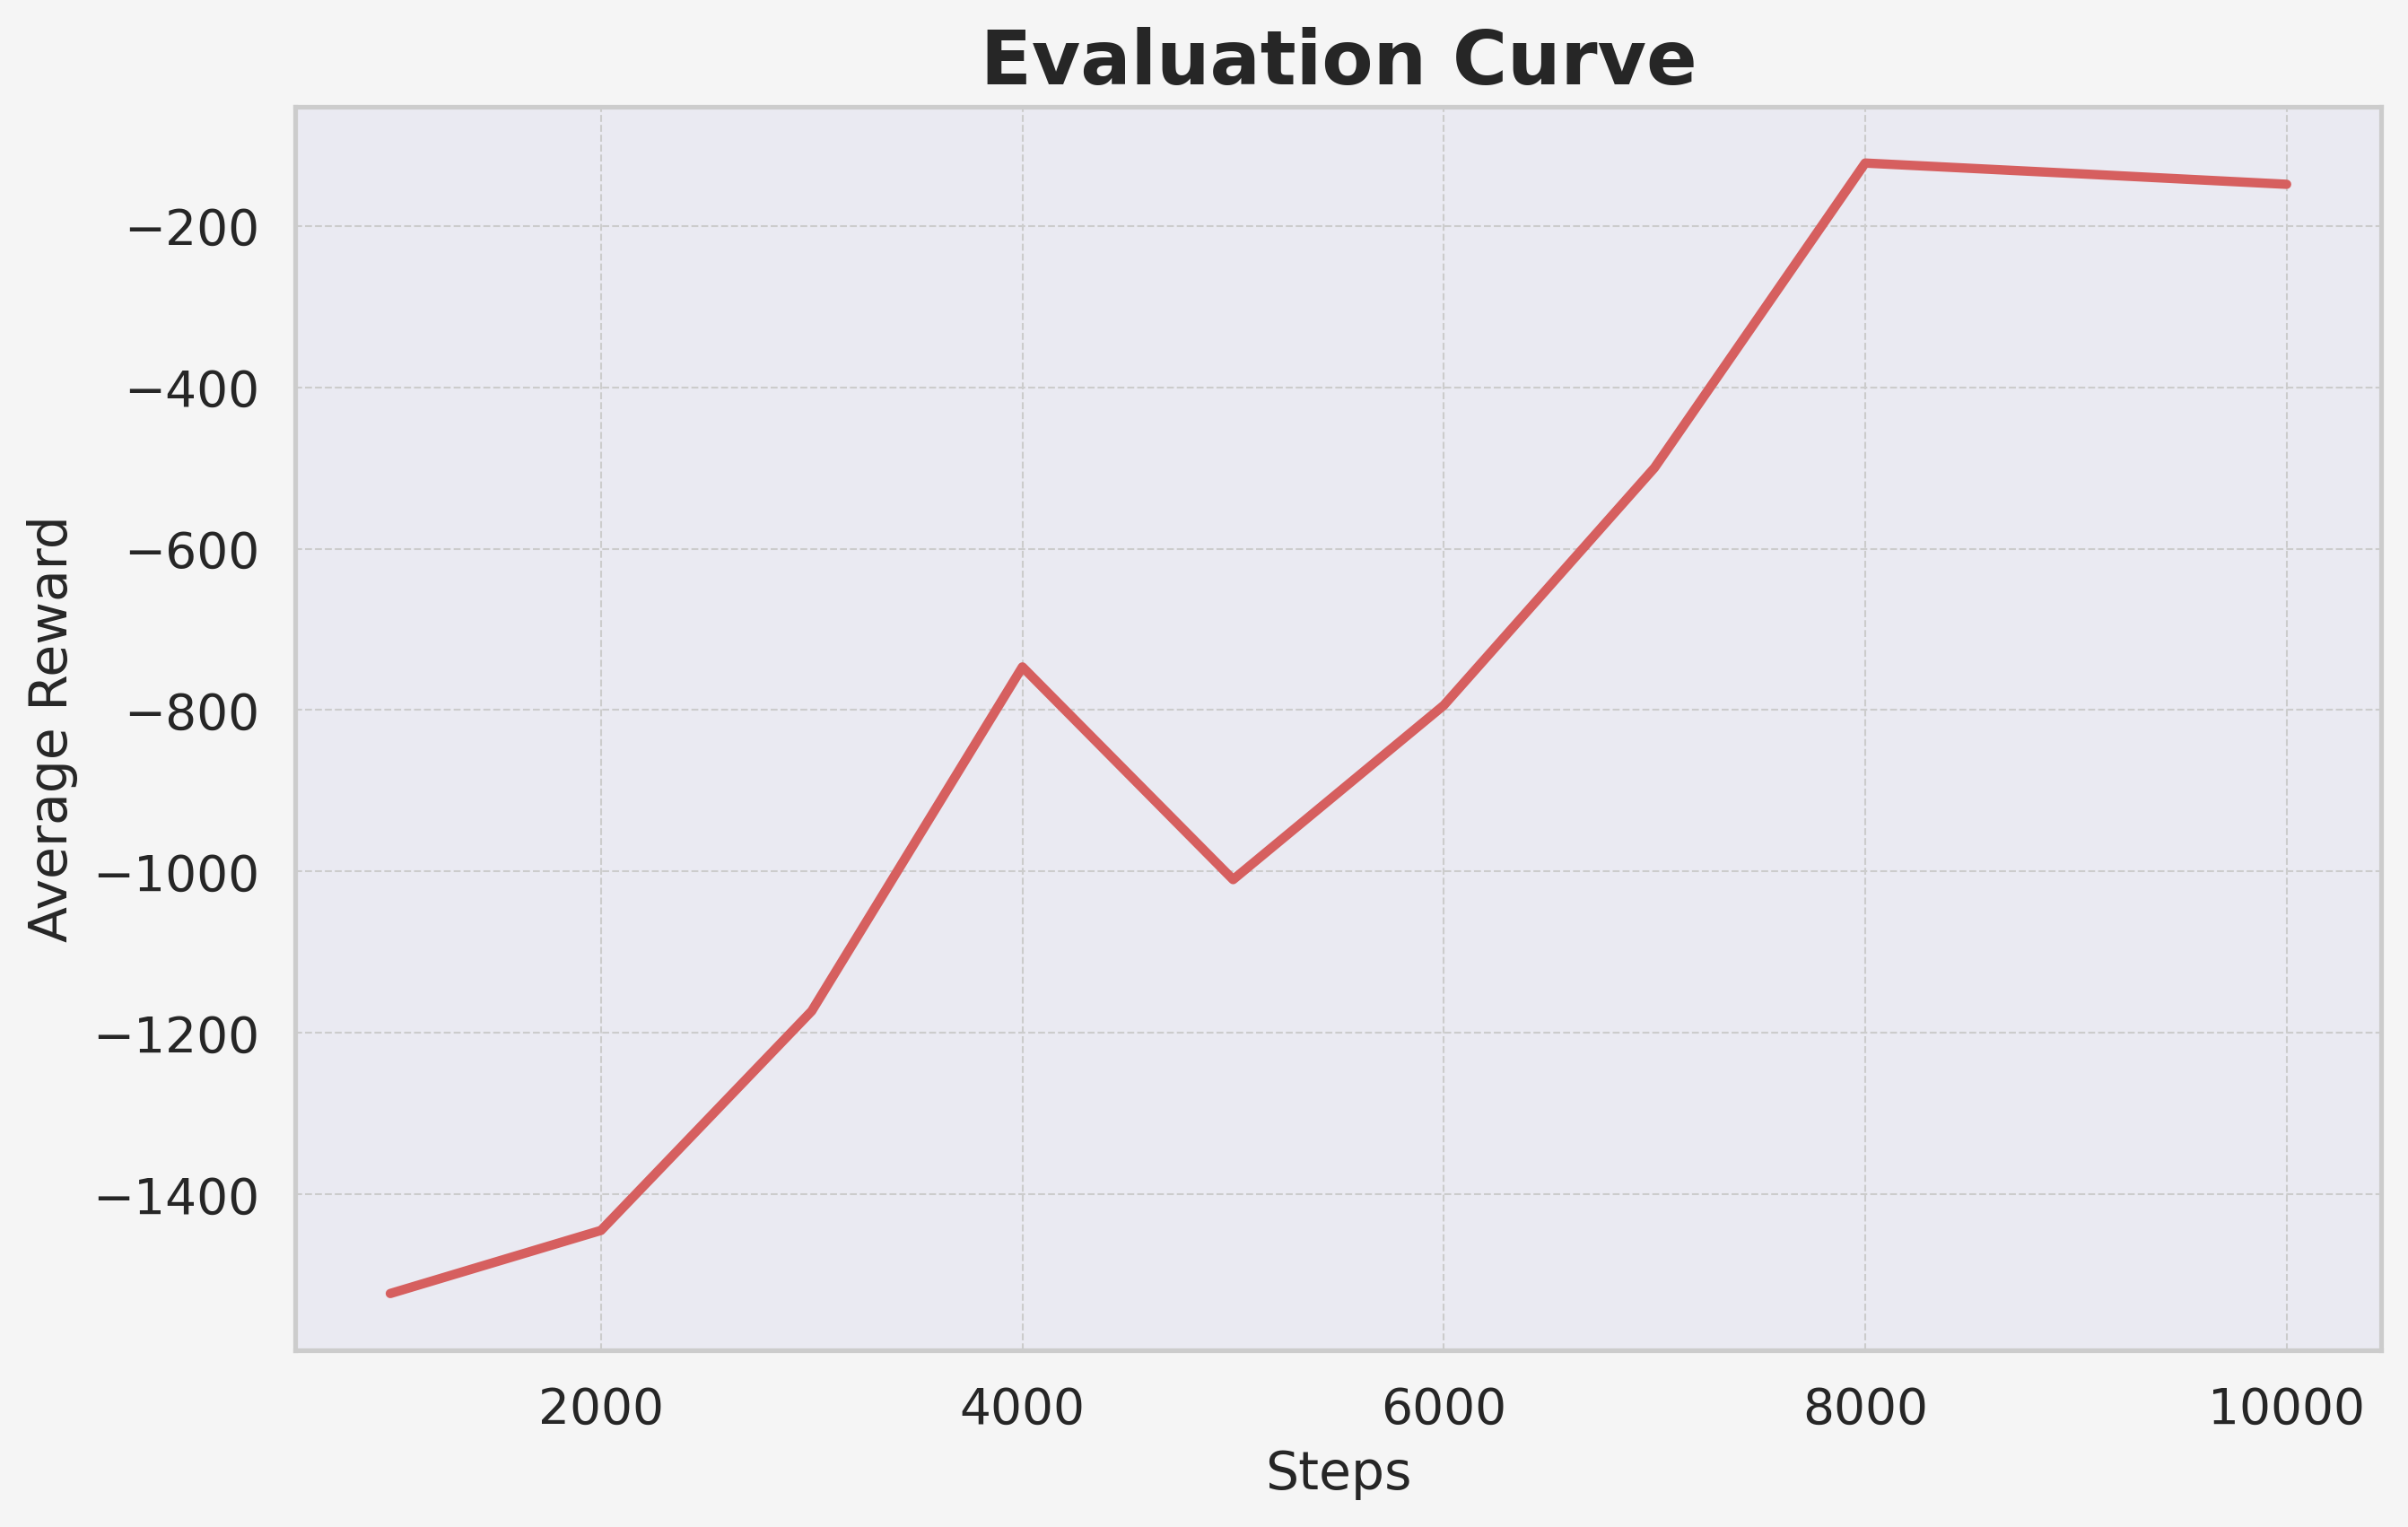
This folder contains the training curve plots and CSV files with detailed data, allowing you to analyze and visualize the results as often as needed.
This folder stores the final trained model of your policy. You can use this model for further evaluation, deployment, or fine-tuning in future experiments.
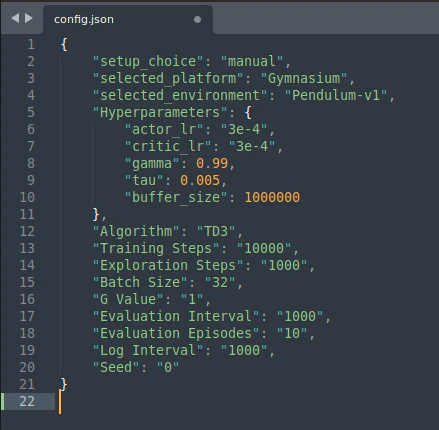
A configuration file is saved, summarizing all the parameters selected for the training session, such as the random seed and hyperparameters. This file serves as a “memory card,” enabling you to easily review the setup for that specific training session.
The configuration file ensures you have a detailed record of your training parameters, making it simple to replicate or adjust experiments.
Bonus Feature: Model Evaluation Video
As an added benefit, ReinforceUI Studio evaluates the final saved model and generates a video of its performance for one episode. This allows you to not only review the training curves but also visually assess how the trained policy performs—offering a deeper, more interactive way to evaluate your results.
This combination of detailed logs, configuration summaries, and visual evaluation makes ReinforceUI Studio an ideal tool for managing and refining your RL experiments.
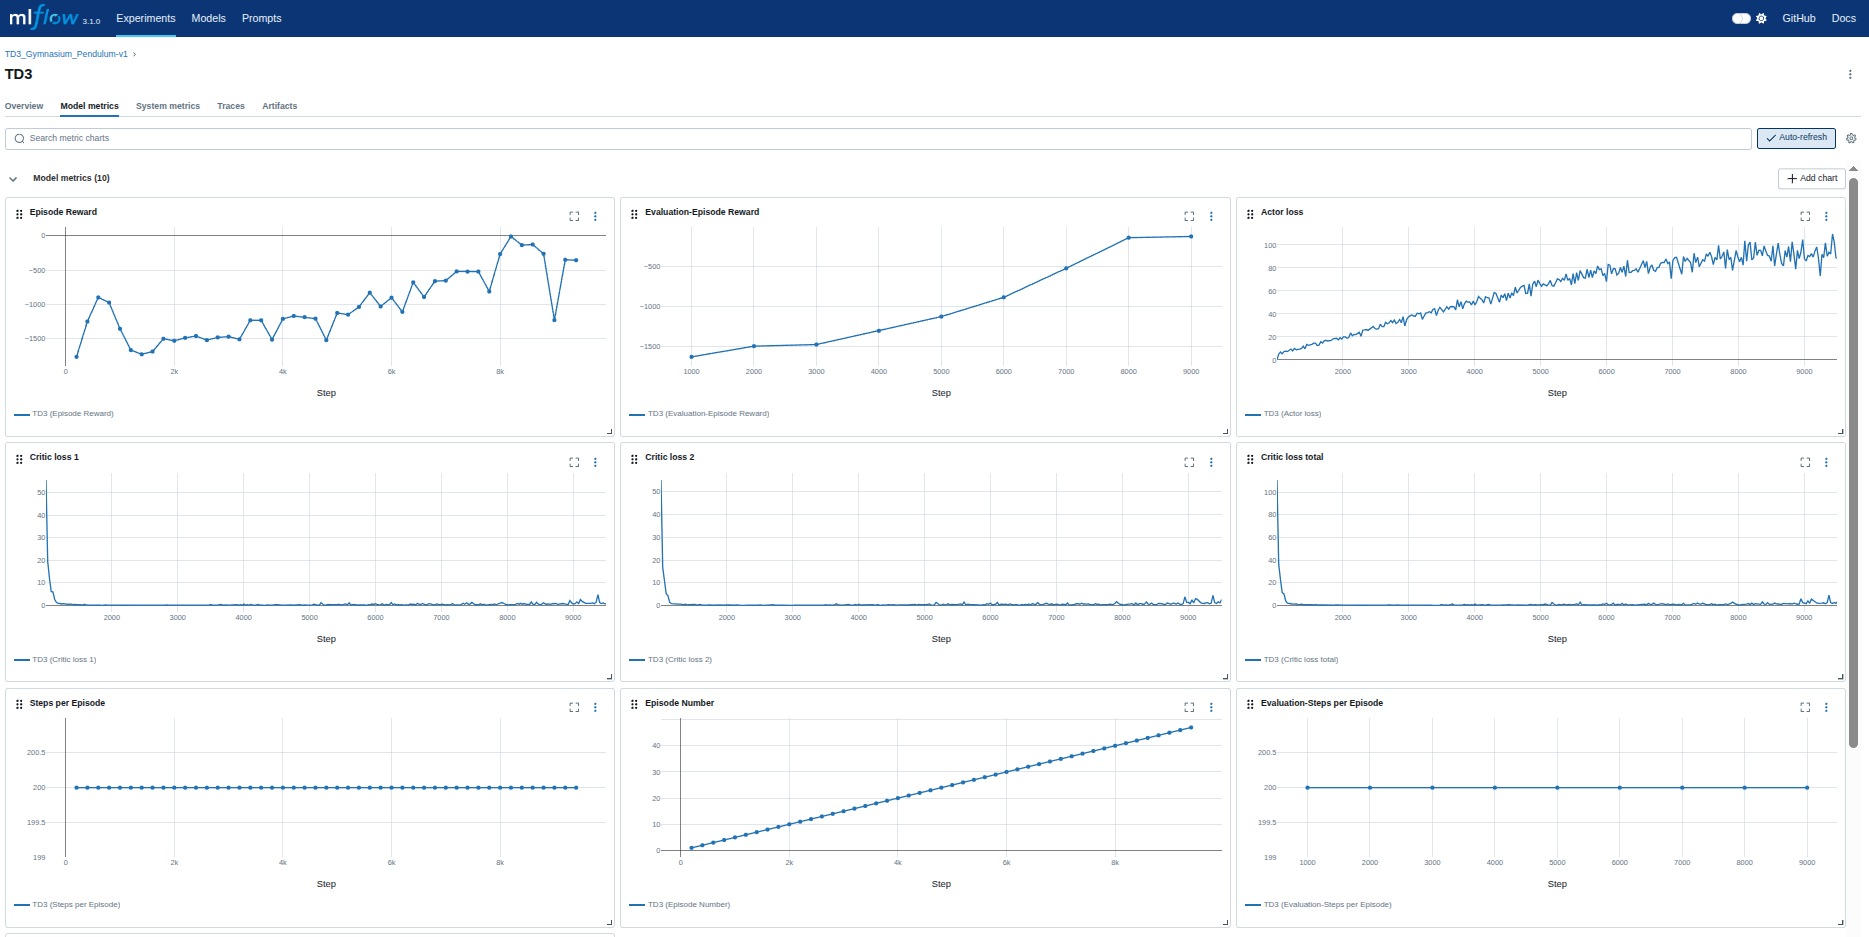
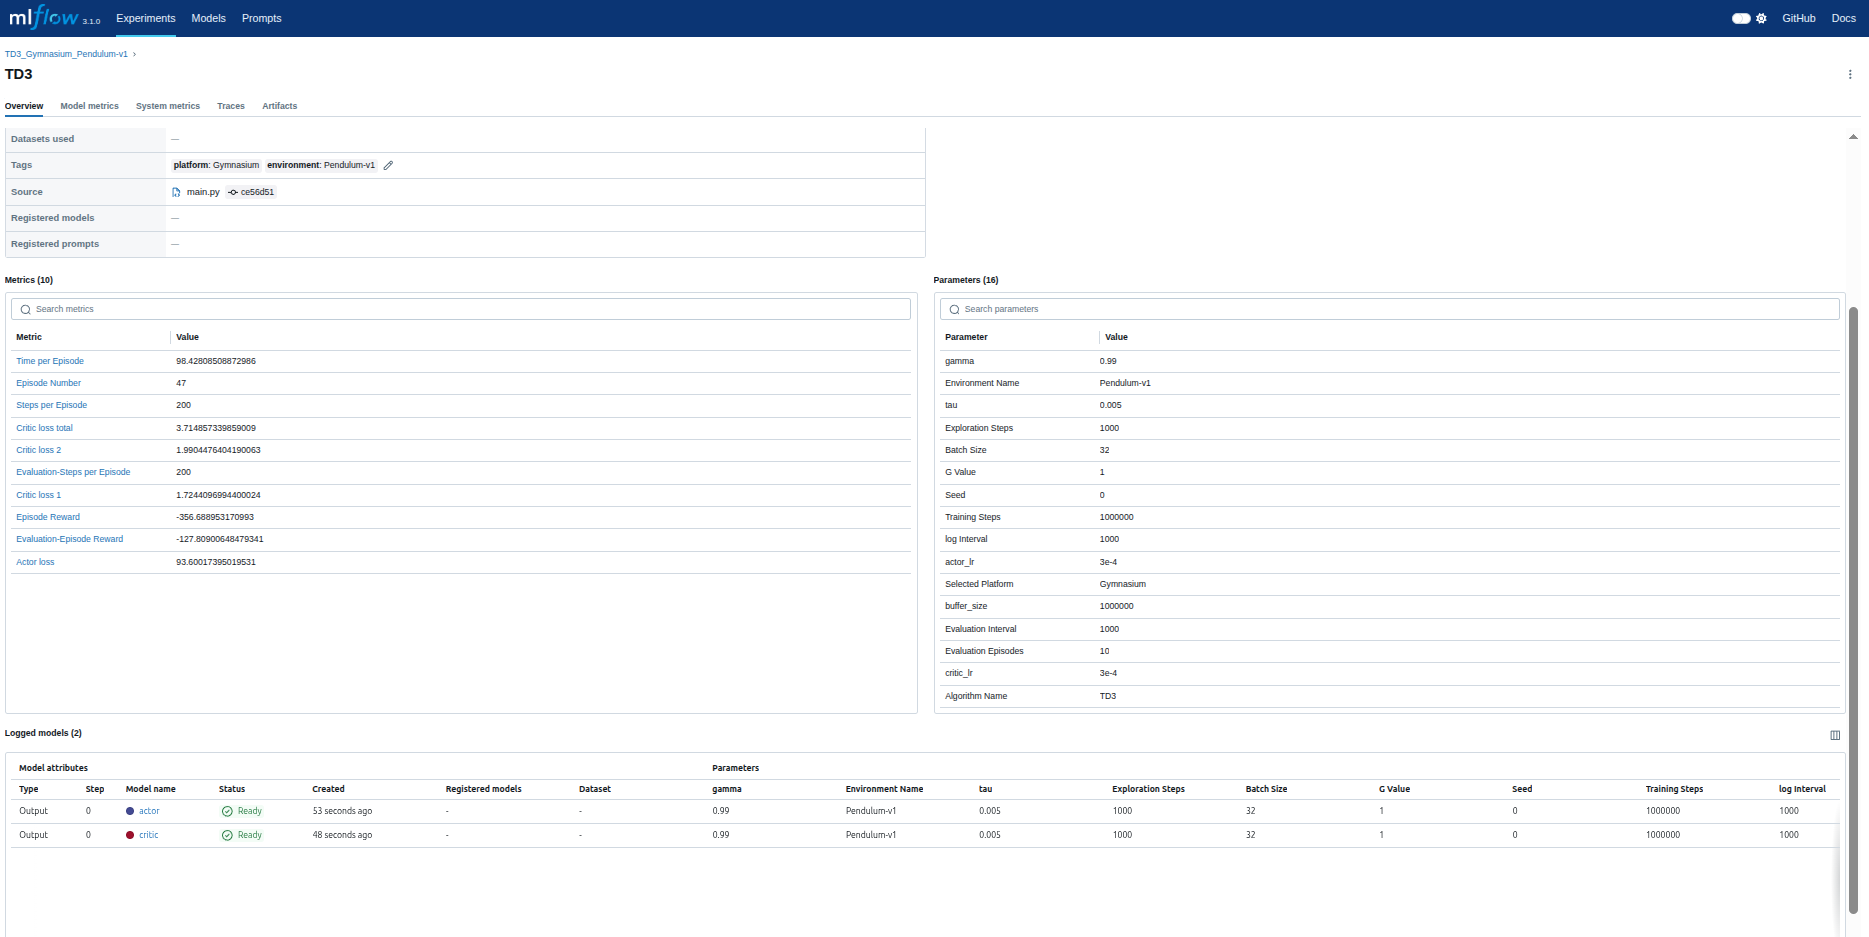
MLflow Integration
ReinforceUI Studio offers seamless integration with MLflow, a powerful tool for tracking and visualizing machine learning experiments. During training, you can click the “Open MLflow Dashboard” button at any time to monitor your experiment’s metrics and artifacts in real time.
After training, you can continue your analysis by opening the MLflow dashboard at http://localhost:5000/ in your browser, allowing for in-depth post-run review and comparison of results.
This integration makes it easy to track, compare, and share your RL experiments, enhancing reproducibility and collaboration.